
The Propensity to Cycle Tool (PCT) was designed to assist transport planners and policy makers to prioritise investments and interventions to promote cycling. The PCT answers the question: 'where is cycling currently common and where does cycling have the greatest potential to grow?'. The PCT can be used at different scales.
First, the PCT is a strategic planning tool. Different visions of the future are represented through various scenarios of change, including the Department for Transport’s draft Cycling Delivery Plan target to double cycling in a decade and the more ambitious ‘Go Dutch’ scenario, whereby cycling levels equivalent to the Netherlands are reached in England and Wales (allowing for English and Welsh hilliness and trip distances). By showing what the rate of cycling could feasibly look like in different parts of cities and regions, and illustrating the associated increase in cycle use on the road network, the PCT should inform policies that seek a wider shift towards sustainable transport.
Second, the PCT can also be used at a smaller scale. The scenario level of commuter cycling along a particular road can be used to estimate future mode share for cycling on that corridor. This can be compared with current allocation of space to different modes, and used to consider re -allocation from less sustainable modes to cater for cycling growth. In other cases, low current or potential flows may indicate a barrier, such as a major road or rail line, causing severance and lengthening trips. This could be addressed through new infrastructure such as a pedestrian and cycle bridge.
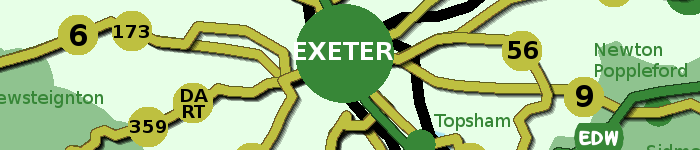
https://www.pct.bike/m/?r=devon
Lovelace, R., Goodman, A., Aldred, R., Berkoff, N., Abbas, A., Woodcock, J., 2017.The Propensity to Cycle Tool: An open source online system for sustainable transport planning. Journal of Transport and Land Use. 10:1, 505–528, DOI: 10.5198/jtlu.2016.862.
MRC Epidemiology Unit The National Propensity to Cycle Tool (PCT) is an online and interactive planning support tool to provide an evidence base to inform investment in cycling.
https://www.youtube.com/watch?v=58UaVb8ZCrc

Devon, MSOA, Ebike scenario, Route network (LSOA, clickable) Percentage of network 90%
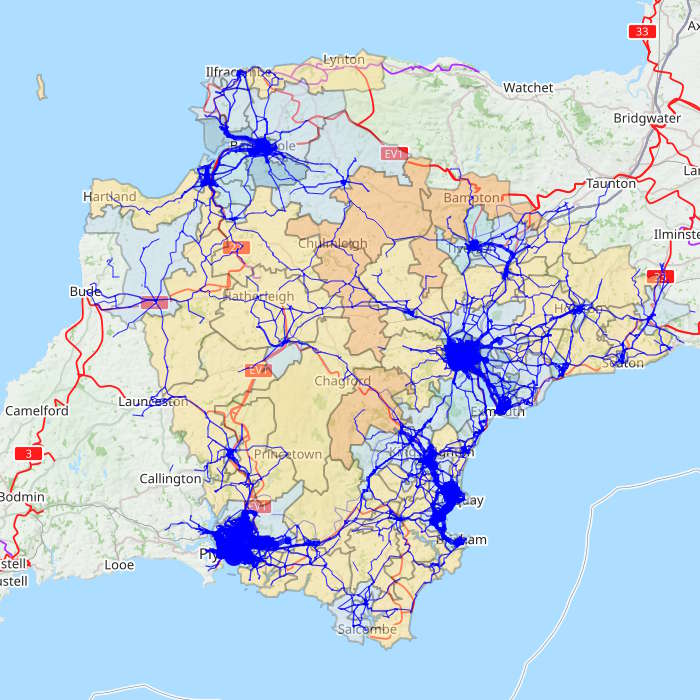
Devon, MSOA, Ebike scenario, Route network (LSOA, clickable) Percentage of network 90%
Scenarios
Baseline data comes from the 2011 Census, which covers main mode of travel to work.
There are four core scenarios:
- Government Target – the target for cycling in England for 2025, involving a doubling of
cycling. - Gender Equality – women cycle at the same rate as men do now, for each origin-destination pair.
- Go Dutch – the population has the same likelihood of cycling a trip as the Dutch would, based on distance and hilliness. In other words this scenario assumes that infrastructural and cultural barrier to cycling have been overcome, but topography and land use remain the same.
- Ebikes – A kind of Go Dutch plus, with the additional assumption that people have access to e-bikes for hillier and longer trips, based on Dutch and Swiss data on rates of e-bike usage for these journeys
CORNWALL PROPENSITY TO CYCLE CASE STUDY
Executive Summary This report examines cycling potential in Cornwall, with a particular focus on four towns and one city – Bodmin, Penzance, Truro, Falmouth and Newquay.
It explains the PCT (Propensity to Cycle Tool) and how it calculated commuter cycling potential. The report focuses on the e-bike scenario, explaining why this is relevant to the case study. Maps are produced showing how current cycling levels compare to cycling potential, and the reductions in driving, health benefits, and CO2 benefits that the tool predicts would result. The focus is then shifted to the five locations and similar calculations are provided for these. Finally, the PCT’s ability to map cycle commuting to the route network is drawn upon in providing schematic possible core cycle networks for the five locations. While the PCT only maps main-mode commuter cycling potential (and will not show cycling potential by students to schools or universities, for instance, or to train stations), some route sections show as much as 250-2000 cycle commuters under the e-bike scenario. The report has been written for Cornwall Council and for the Department for Transport, which commissioned the PCT; but does not necessarily represent the views of those organisations
https://npct.github.io/pct-shiny/regions_www/www/static/03b_case_studies/cornwall-case-study.pdf